Sales Pipeline & Forecast
Revenue teams operate on outdated forecasts and siloed data. By the time you spot a problem, it's already too late to fix it.
Demo video
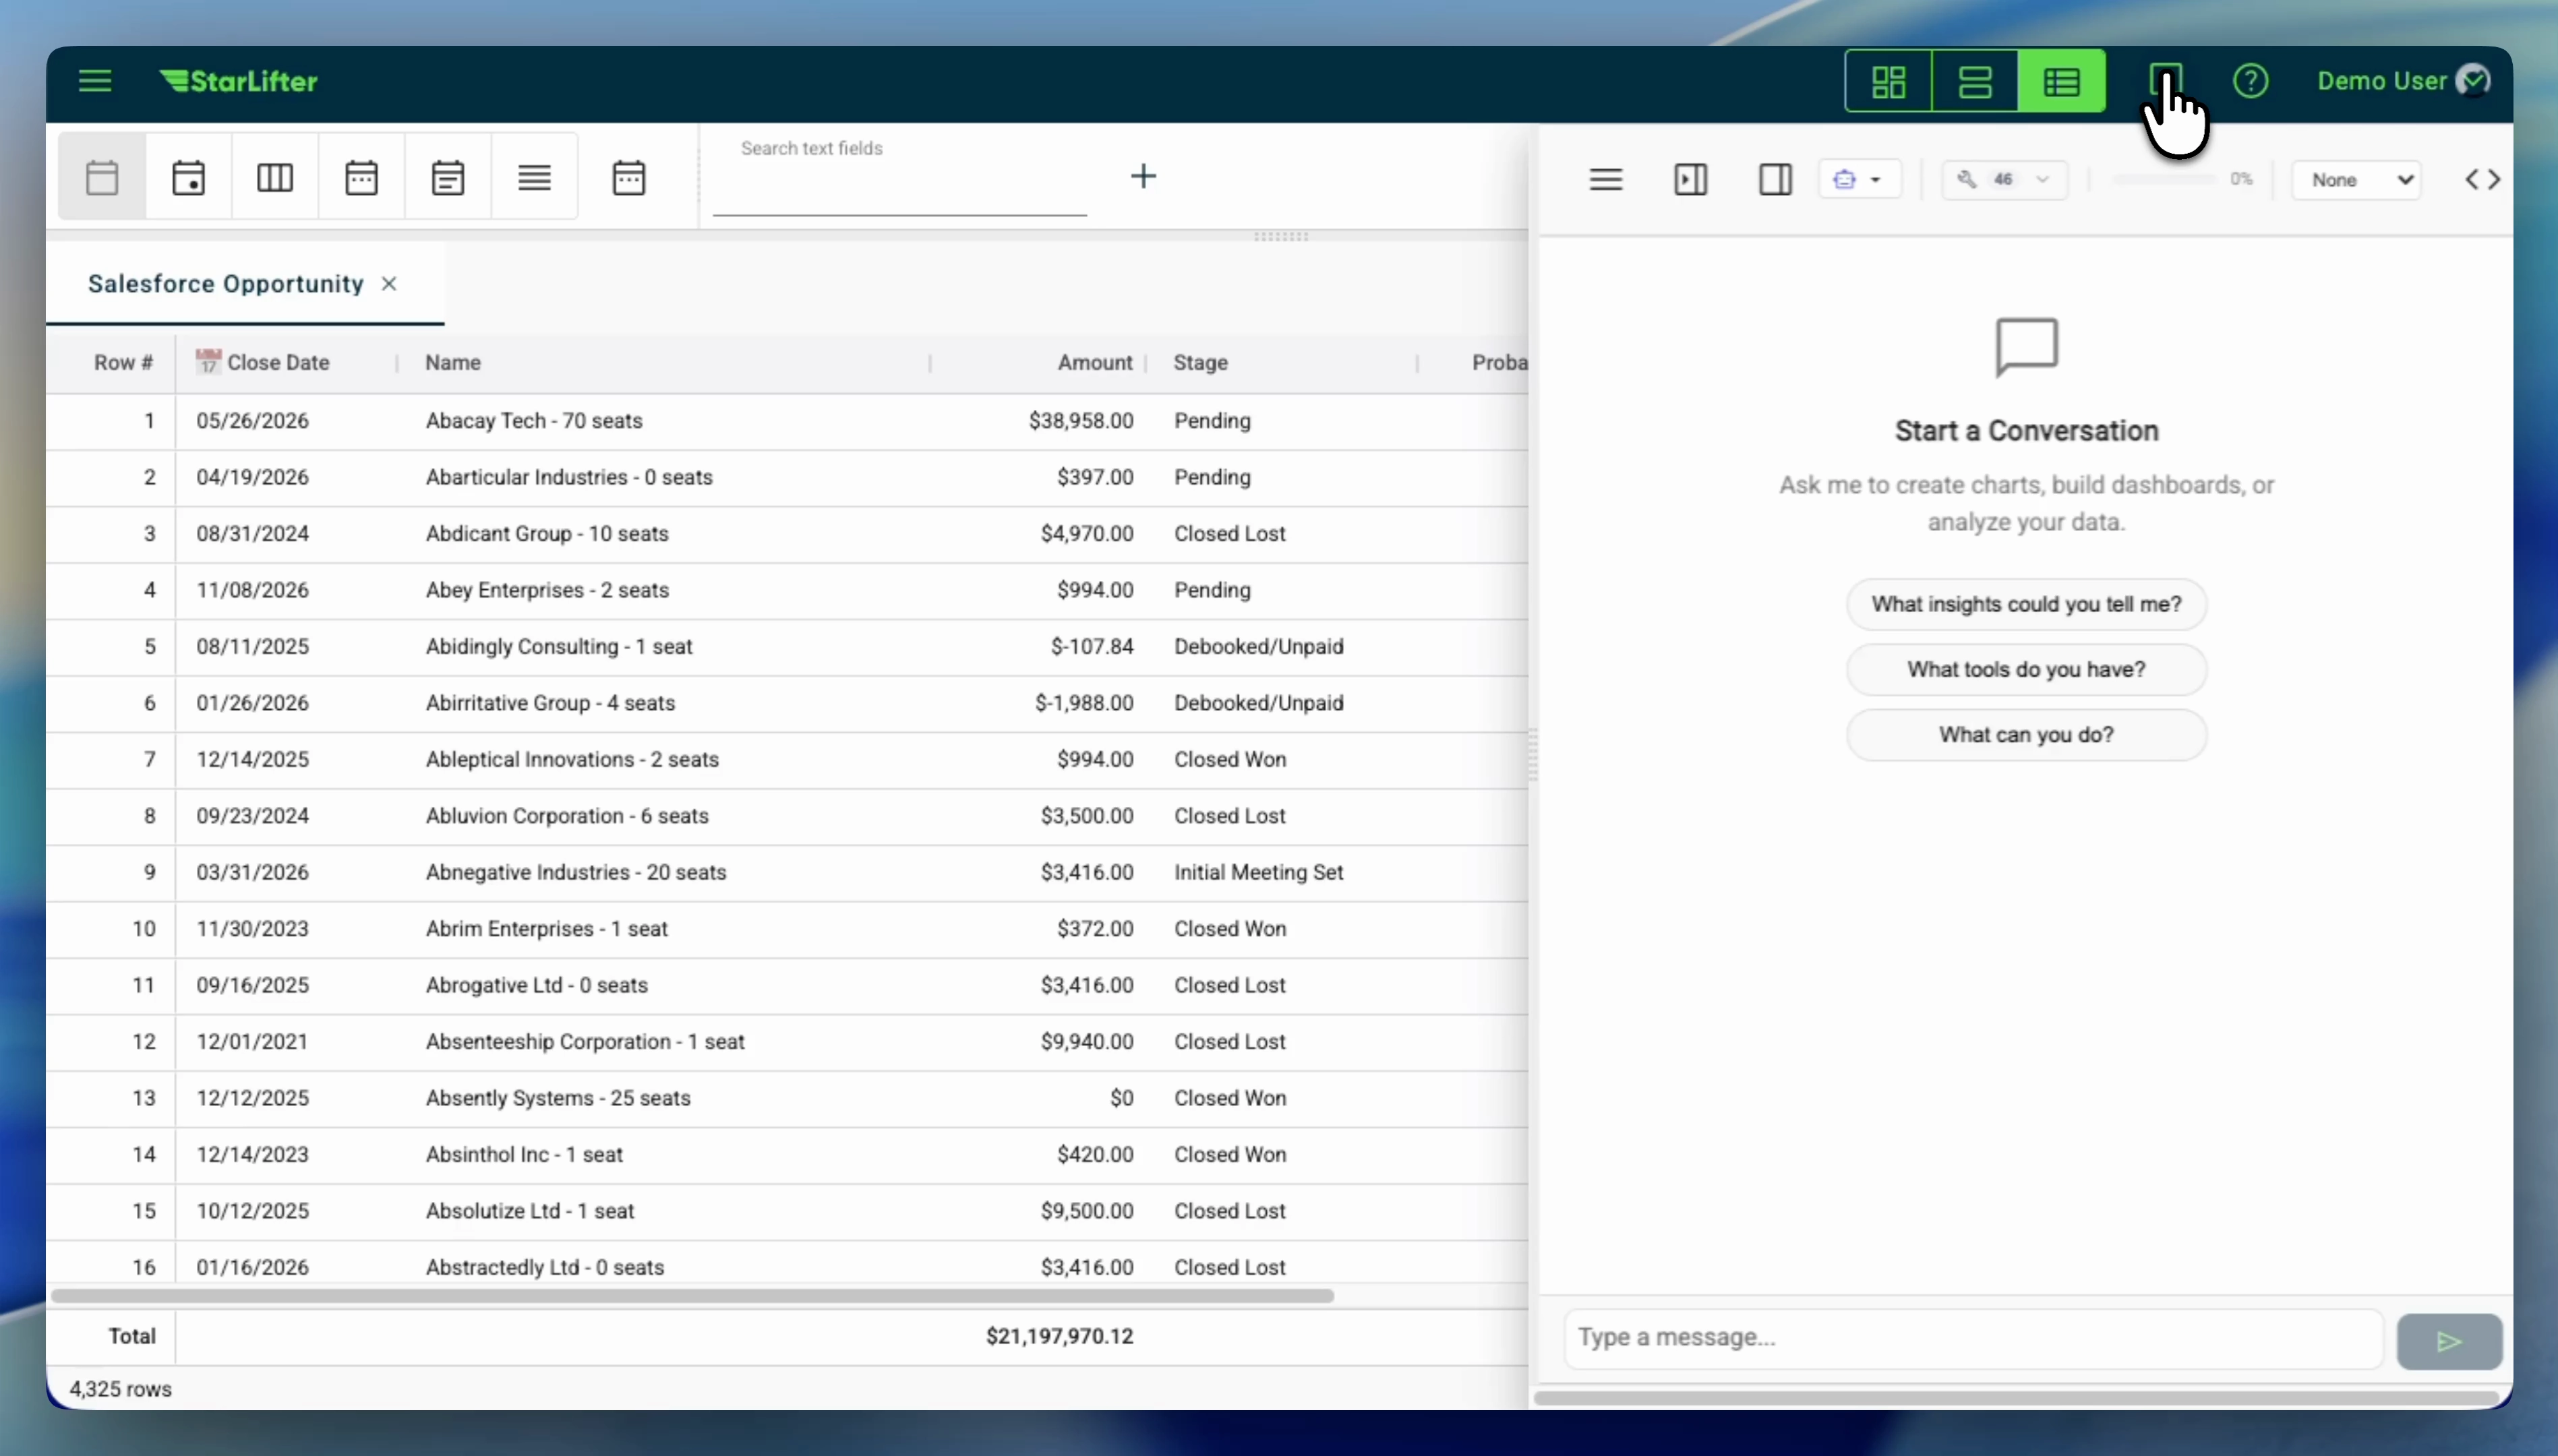
Forecast anomaly review from Salesforce opportunities
Forecast anomalies, root-cause context from opportunities, and a leadership-ready summary—filmed as a Salesforce-forward pipeline and forecast review.
Operating gaps
When “the number” lives in three different surfaces
CRM tabs, warehouse rollups, and slide decks often disagree on coverage, stage, or commit. Teams want one governed view where refresh cadence, grain, and field definitions are explicit—so reviews spend time on judgment, not reconciliation.
When forecasts need history, policy, and human judgment together
Rolling up the forecast is rarely a pure math exercise—it blends stage rules, seasonality, and what reps know about specific accounts. The friction is keeping that judgment next to governed data instead of scattered notes and offline spreadsheets.
When deals look fine in CRM until the late-stage surprise
Stalled activity, missing economic buyers, or odd stage aging are familiar warning patterns—but they are easy to miss in static pipeline charts. Teams often want those signals expressed with the same thresholds leadership already agreed on.
When coaching needs a shared definition of “good”
Managers compare activity, conversion, and progression—but only if stage rules and segments mean the same thing week to week. The pain is usually inconsistent definitions, not a lack of dashboards.
Example Workflow
One possible pipeline review—your cadence, roles, and systems will differ. The goal is a repeatable surface where numbers, context, and approvals line up.
Open the Forecast View
Current pipeline, commit numbers, and AI-adjusted forecasts load automatically from Salesforce.
Review At-Risk Deals
Filter the pipeline view to see deals flagged for stalled activity or missing next steps.
Update Deal Inputs
Add notes, adjust fields, and write updated values back to Salesforce for alignment.
Share the Weekly Snapshot
Export a summary to Slack or email for leadership — formatted and ready to go.
Patterns teams model here
Pipeline and forecast context sit next to the CRM fields, warehouse facts, and approval paths your revenue team already owns.
- • Join pipeline, commit, and forecast context with explicit grain and refresh rules
- • Highlight deals that violate the risk patterns your leadership already cares about
- • Record updates, notes, or scores with governed write-back where your teams work today
- • Package weekly or monthly snapshots without re-deriving metrics in slides
- • Keep thresholds and decision definitions consistent when stages, segments, or policies change
Data Sources & Integrations
Pipeline and forecast signals usually live in CRM systems, governed warehouse models, and spreadsheets before leadership reviews them. StarLifter connects to the same analytical layer and operational systems we support across the platform—so revenue teams work from one decision surface.
Snowflake, Databricks, Google BigQuery, and Amazon Redshift—where pipeline, forecast, and revenue metrics are often curated.
Azure MS SQL and other SQL systems where operational or analytical tables already live.
Salesforce, HubSpot, and ServiceNow for context and governed write-backs where your teams work today.
CSV and uploaded tables for territory plans, exceptions, or sources that still live outside the warehouse.
For the full list of supported connections and how they map to your stack, see our Integrations page. If a source you need is not listed yet, ask us—we are adding connectors over time.
2-Week Deployment
Illustrative starting cadence. Week-one work tracks the objects and fields you already trust in CRM and analytics.
Connect & configure
- • Connect Salesforce/HubSpot and validate data sync
- • Configure pipeline stages and forecast categories
- • Set up risk scoring rules and thresholds
Train & launch
- • Team training sessions for managers and reps
- • Fine-tune dashboards based on feedback
- • Go live with ongoing support
Stop flying blind
Walk us through how you review pipeline and forecast today—we will show where governed definitions and actions could sit on one surface.
Join the Waitlist